2023 Office Supplies Sales Dashboard
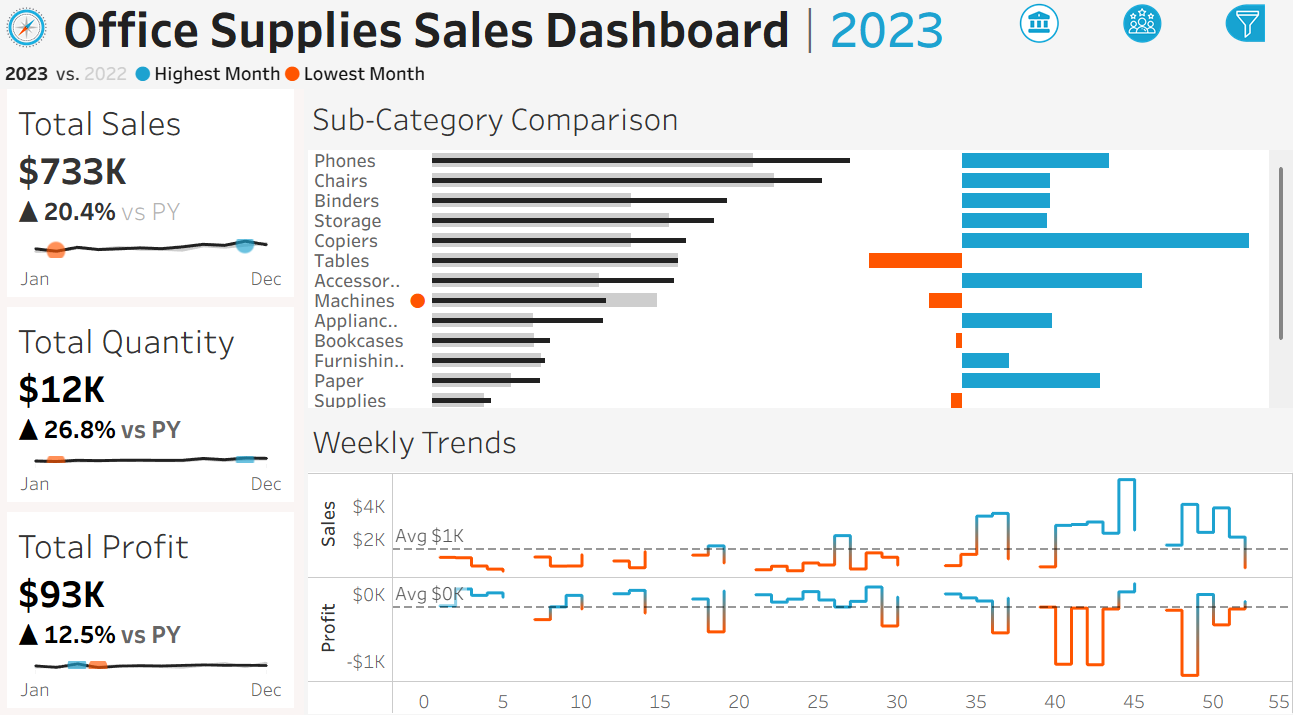
This sales dashboard for office supplies an at-a-glance comparison of business performance in 2023 versus 2022. Total sales reached $733K, representing a 20.4% increase over the previous year, indicating strong overall revenue growth. Total quantity sold increased by 26.8% to 12K units, showing that sales volume grew faster than revenue, which may suggest pricing or discount effects. Total profit rose to $93K, up 12.5% year over year, a positive gain but slower than sales growth, indicating some pressure on profit margins.
The sub-category comparison section breaks down performance by product type, allowing quick identification of which categories contributed most to sales and which lagged behind. The highest- and lowest-month indicators reveal seasonality and volatility within each category, highlighting areas of consistent performance versus those with sharp fluctuations. The weekly trends at the bottom show how sales and profit changed throughout the year, with sales frequently exceeding the average weekly level while profit shows greater variability, including several loss weeks. Overall, the dashboard shows strong top-line growth in 2023 with opportunities to improve margin stability and profitability.
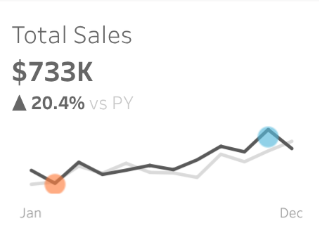
Total Sales:
The total sales visual shows that revenue in 2023 reached $733K, reflecting a 20.4% increase compared to 2022. The small monthly trend line illustrates how sales progressed from January through December, with clear identification of the highest and lowest months, helping quickly spot seasonal peaks and slower periods across the year.
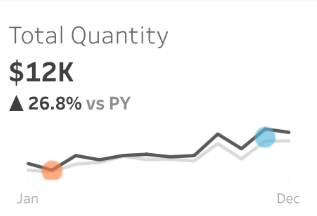
Total Quantity:
The total quantity visual indicates that 12K units were sold in 2023, representing a 26.8% increase year over year. Because quantity grew faster than sales, this suggests higher sales volume but potentially lower average selling prices or increased discounting compared to the previous year.
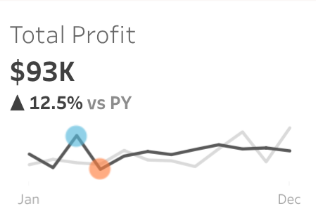
Total Profit:
The total profit visual shows a profit of $93K in 2023, up 12.5% from the prior year. While profitability improved, the smaller growth rate compared to sales and quantity suggests margin pressure, possibly due to higher costs or promotional activity during the year.
The data shows how difficulty varies by cooking method, with baked and pressure-cooked dishes rated as more difficult, while grilled and panini-style meals are easier on average. The average rating by gender chart shows that both male and female reviewers rate dishes similarly, suggesting consistent satisfaction across genders.

Sub-Category Comparison:
The sub-category comparison visual contrasts 2023 performance against 2022 across individual product categories such as phones, chairs, and storage. This view highlights which categories experienced growth, which declined, and where sales were relatively stable, helping identify key drivers of overall performance.
Highest and Lowest Month by Sub-Category:
This visual highlights the best and worst performing months for each sub-category. The contrast between the highest and lowest months reveals seasonality and volatility, making it easier to identify categories that are consistent versus those that depend heavily on specific times of the year.
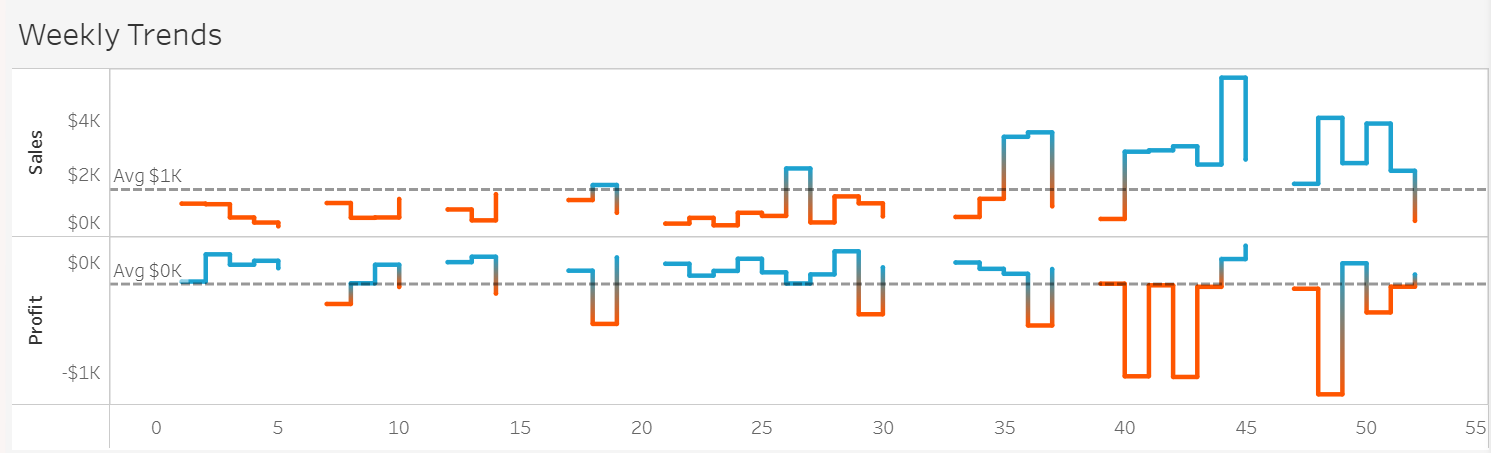
Weekly Trends:
The weekly trends visual shows how sales and profit fluctuated throughout the year compared to their respective averages. Sales demonstrate periodic spikes above the average weekly level, while profit displays greater volatility, including several weeks below zero, indicating weeks where costs outweighed revenue.
Summary:
The dashboard indicates that while sales volume and revenue grew strongly in 2023, profit growth lagged due to inconsistent margins, cost fluctuations, and uneven performance across products and weeks.
Real Solutions:
Implement category-level margin tracking and set minimum profit thresholds, reduce excessive discounting during high-volume periods, renegotiate supplier and shipping costs for low-margin items, adjust inventory and staffing around historically unprofitable weeks, and shift marketing spend toward sub-categories and seasons that consistently generate higher profit rather than just higher sales.
The dataset and Tableau visualizations can be shared upon request.