
Progression of Global Agricultural Land from 1990 to 2013
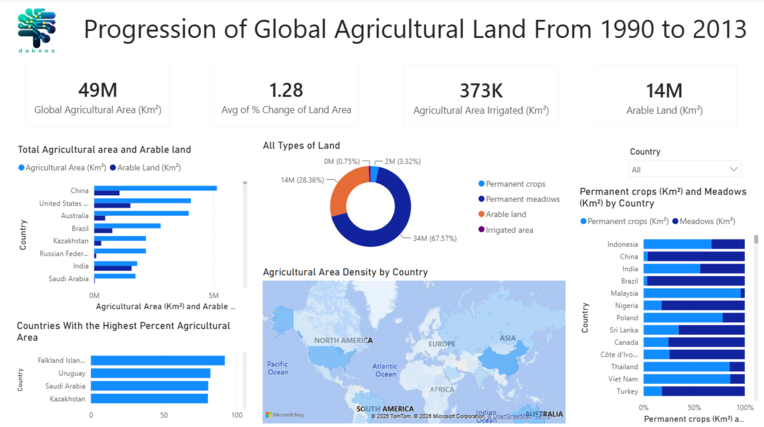
This dashboard examines how agricultural land has changed across countries and how different types of agricultural land (arable land, permanent crops, meadows, and irrigated land) contribute to global agriculture. The dashboard combines KPIs, bar charts, a donut chart, and a world map to provide both global and country-level insights.
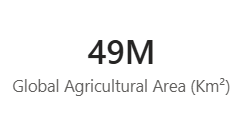
Global Agricultural Area (49M km²)(19M mi²)
The world has about 49 million km² of agricultural land. This shows that farming uses a large amount of land and plays a major role in producing food globally..
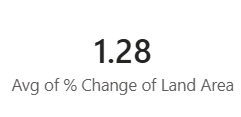
Average % Change of Land Area (1.28%)
Agricultural land increased by an average of 1.28% between 1990 and 2013. This small increase suggests that farmland has remained fairly stable over time.
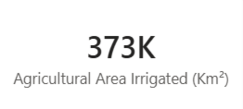
Agricultural Area Irrigated (373K km²)(150K mi²)
About 373 thousand km² of farmland is irrigated. Irrigation helps crops grow in areas with little rainfall and can increase food production.
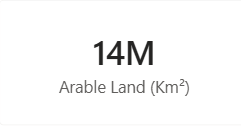
Arable Land (14M km²)(5.4M mi²)
There are about 14 million km² of arable land, which is land suitable for growing crops. Protecting this land is important because it is needed to produce much of the world's food.
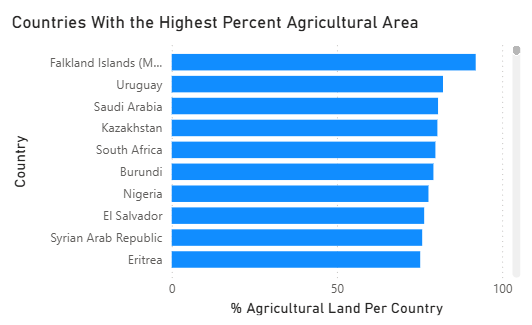
Countries with the Highest Percentage Agricultural Area
Unlike total land area, the chart measures the percentage of each country's land devoted to agriculture. Countries such as the Falkland Islands, Uruguay, and Saudi Arabia rank highest because agriculture occupies a large share of their available land. The chart demonstrates that even smaller countries can have very high agricultural intensity despite having less total farmland.
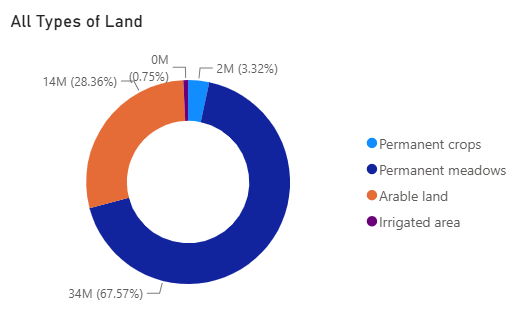
Distribution of Agricultural Land Types
The specific visualization shows that permanent meadows account for about 68% of global agricultural land, while arable land makes up around 28%, with irrigated land and permanent crops representing much smaller shares. This indicates that livestock grazing occupies far more land than crop production. It also highlights the limited amount of land available for growing food crops directly.
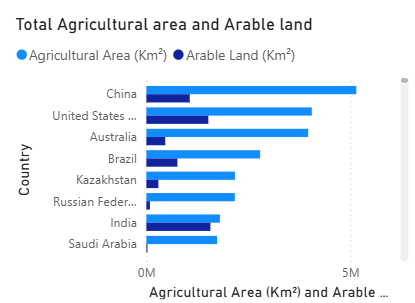
Total Agricultural Area and Arable Land by Country
This chart compares countries based on their total agricultural and arable land. China, the United States, Australia, Brazil, and other large nations have the greatest agricultural areas due to their size and diverse farming industries. The visualization shows that geography, climate, and technological development all influence how much land countries dedicate to agriculture, because the leaders are also leaders in innovation and development.
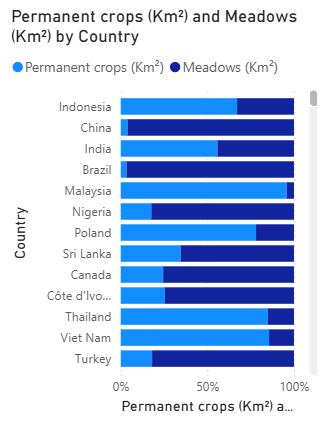
Permanent Crops and Meadows by Country
This chart compares permanent crops and meadows across several countries. Tropical countries like Indonesia, Malaysia, and Côte d'Ivoire have larger shares of permanent crops due to plantation farming, while countries such as Canada and Poland have more meadows for livestock grazing. The comparison shows how climate and geography influence agricultural specialization across different regions.
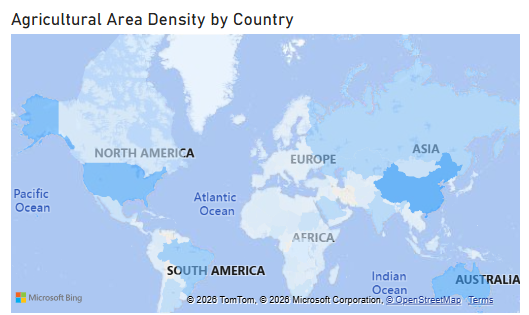
Countries with the Most Agricultural Area
This world map illustrates that countries such as China, the United States, Brazil, Russia, India, and Australia contain the largest agricultural areas. Their large land masses and favorable agricultural conditions allow them to support extensive farming activities. The map also makes regional patterns easy to identify by showing where agriculture is most concentrated around the world.
Overall Summary & Solutions
The dashboard highlights how agricultural land is distributed across the world and how different countries use it. The Total agricultural and arable land visualization shows that large countries such as China, the United States, Brazil, and Australia dominate in total agricultural area because of their size and farming industries. The Distribution of Agricultural Land Types reveals that permanent meadows make up the majority of global agricultural land, while arable land accounts for a much smaller share, emphasizing that livestock grazing occupies more land than crop production. The world map reinforces these findings by visually showing that agricultural land is concentrated in large countries across North America, South America, Europe, Asia, and Australia.
As well as that, this dashboard also demonstrates that agricultural land is used differently depending on the country. The countries with the highest percentage of agricultural land reveals that smaller nations, such as the Falkland Islands and Uruguay, devote a much larger portion of their land to agriculture than many larger countries. Meanwhile, the visualization of permanent crops and meadows shows how climate influences agricultural specialization, with tropical countries focusing on permanent crops like plantations and temperate countries relying more heavily on meadows for livestock grazing. Together, these visuals show that geography, climate, and economic needs all play major roles in shaping agricultural systems.
Based on these findings, the best approach for the future is to improve the productivity of existing farmland instead of expanding agriculture into forests and natural ecosystems. Governments should invest in sustainable farming practices, modern technology, efficient irrigation systems, and soil conservation to increase crop yields while protecting the environment. Countries should also adopt farming methods that match their climate and available resources, such as improving grazing management in pasture-dominated regions and increasing crop efficiency where arable land is limited. These solutions can help meet future food demands while preserving natural resources and ensuring long-term agricultural sustainability.